For the past six years, VerityStream has been conducting an annual survey on provider enrollment. Our goal is to uncover top enrollment trends so that organizations like yours can better evaluate and manage their processes. This year, we surveyed over 500 Provider Enrollment professionals, the majority of whom were part of a physician or medical practice who are standalone, a corporate location of a health system (including health system-based CBOs), and hospitals that are part of a health system.
This year, we refined our questions to unearth details on Financial Outcomes and Implications. The intent is to understand how staffing levels impact the ability to enroll in an efficient manner and how claims, including holds and write-offs, are trending across the industry. In this post, we’ll dive into some of our top findings.
The Importance of Financial Outcomes
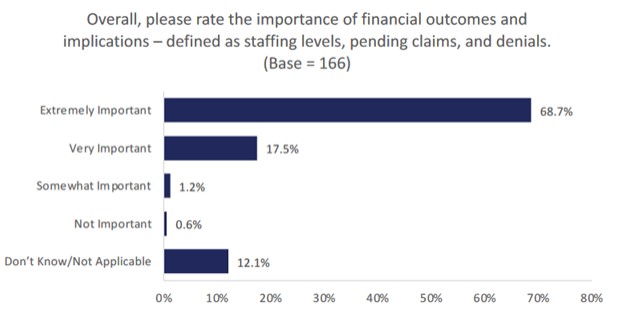
Financial Outcomes and implications are defined as staffing levels, pending claims, and denial of claims. We began our survey by gauging the overall importance of financial outcomes and implications to our Provider Enrollment experts. Unsurprisingly, the majority of survey respondents agreed that financial outcomes are “extremely important” for their organizations.

Staffing
When it comes to staffing, 41.5% of Provider Enrollment professionals who were surveyed said that their position reported to a senior leader. Some 12.6 percent said they reported to either Medical Staff Services or Enrollment. Less than 10 percent reported to Revenue Cycle (6.9%), CVO (5.7%), Contracting (4.4%), or Billing Services (3.1%). Some 13.2 percent said their position reported to an alternate department, citing “other.” The reporting relationship was similar to the 2021 results, the first year the question was asked.
We next explored the ratio of Full Time Equivalents (FTEs) whose primary work is enrollment to the number of providers managed. More than half (56.3%) of participants reported their ratio of FTEs whose primary work is enrollment to the number of providers was 1 FTE to 250 providers or less. 24.1% said they had 1 FTE to 251-500 providers, and less than 10 percent had either 1 FTE to 501-600 (6.6%), 601-700 (3.9%), or 1 FTE to more than 700 providers (9.1%). Comparing 2021 results to 2022 there was a decrease in the FTE to 250 providers or less while most other categories increased. This question was added to the survey in 2021, so it will be interesting to see how these numbers shift in the coming years.
| Staffing Category | 2022 | 2021 |
|---|---|---|
| 1 FTE to more than 700 providers | 9.1% | 5.6% |
| 1 FTE to 601-700 providers | 3.9% | 2.6% |
| 1 FTE to 501-600 providers | 6.6% | 6.6% |
| 1 FTE to 251-500 providers | 24.1% | 20.1% |
| 1 FTE to 250 providers or less | 56.3% | 65.1% |
| 1 FTE to more than 700 providers | 9.1% | 5.6% |
| Contracting | 4.4% | 3.6% |
| Billing Services | 3.1% | 3.9% |
| Other | 13.2% | 11.8% |
Claims
Survey participants were asked a series of questions about their organization’s efforts to reduce pending claims and denials. One consistent finding across all areas was how many respondents don’t have access to that respective data. Several common enrollment terms were defined as follows for participants to reference as they answered these questions:
- On Hold – claims that are awaiting confirmation of enrollment from the payer
- Denied – claims that have been denied by the payer
- Written Off – claims that have been written off because of delay in enrollment time frames which would make the claim ineligible to be paid
On Hold: Respondents were directed to provide the overall average if their organization completes enrollment for more than one state. While the majority of participants either did not have access to this data or did not feel comfortable providing this information, those who did reported it was less than $500,000.
Write off: 56.8% of all survey participants affirmed their organization and/or enrollment department tracked the average dollars written off. While a third of respondents reported they did not have access to this data, 4.7% said their organization and/or enrollment department did not track the average dollars written off.
Dollars, dollars, dollars
As we’ve established, most respondents agreed that financial outcomes are of huge importance and agreed that staffing levels, pending claims, and denials all had a direct impact on revenue. But, when it came to claims on hold and claims written off from previous years, results indicate a lack of visibility into this data. 53% do not have access to data for claims on hold and 38.5% do not have access to dollars written off. This means there is ample opportunity for these organizations to implement systems that allow them to better track their dollars to ensure nothing is falling by the wayside.
In Summary
As we head into a potential recession, saving dollars wherever possible is paramount. What might these survey findings help you uncover within your organization? We hope it’ll give you inspiration for making changes that help your bottom line. This year’s annual survey uncovered many additional findings on The No Surprises Act, integrating with external services such as CAQH or PECOS and managing provider data. Get the full scoop by downloading the report, or watch the webinar uncovering the results. We hope you find this information as valuable as we did, and if you have any questions, we’re only a phone call away.
